


Alright, SCHD current SEC yield of 3.88% and distribution yield of 3.97% teamed with solid dividend growth makes it a strong pick for investors chasing both income and capital gains. The Schwab U.S. Dividend Equity ETF (SCHD) delivers qualified dividend income with tax advantages while maintaining consistent growth that beats inflation by healthy margins.
Whether you’re stacking shares through a dividend reinvestment plan (DRIP) or counting on steady retirement income, SCHD’s yield and growth combo delivers cash flow now and shields your purchasing power down the road. This analysis examines current metrics, historical performance patterns, and sustainability factors that make SCHD unique in today’s dividend ETF landscape.
Important Notice: SCHD 3-for-1 Share Split Impact
SCHD executed a 3-for-1 share split on October 10, 2024. This split significantly affects how historical data should be interpreted:
| Split Details | Information |
|---|---|
| Split Ratio | 3-for-1 |
| Record Date | October 9, 2024 |
| Effective Date | October 10, 2024 |
| Pre-Split Price | $85.02 |
| Post-Split Price | ~$28.34 |
What This Means for Investors:
- If you owned 100 shares pre-split, you now own 300 shares
- Your total investment value remains unchanged
- All historical per-share prices and dividends should be adjusted by the 3-for-1 ratio for accurate comparison
- Lower share price increases accessibility for smaller investors
All historical data in this article reflects split-adjusted figures for consistency.
SCHD Key Metrics Summary
| Metric | Value |
|---|---|
| Ticker Symbol | SCHD |
| SEC Yield (30 Day) | 3.86% |
| Distribution Yield (TTM) | 3.97% |
| Expense Ratio | 0.06% |
| 10-Year Annualized Return | 10.56% |
| Assets Under Management | $68.73 billion |
| Holdings Count | 103 companies |
| Latest Quarterly Dividend | $0.2488 per share (post-split) |
| Annual Dividend (TTM) | $1.04 per share (post-split) |
Source: Schwab Asset Management, June 2025
SCHD Key Yield Metrics
SCHD Current Dividend Yield
SCHD’s 3.88% SEC yield (3.97% distribution yield) dividend yield is the most recent quarterly dividend of $0.2488 per share (post-split adjusted), or $1.04 on a yearly basis. This makes SCHD competitively positioned in the space of dividend ETFs and stable in times of market volatility.
Latest Yield Metrics and Historical Context (Split-Adjusted)
| Entry Year | Purchase Price (Split-Adjusted) | Current Yield on Cost | Dividend Growth Impact |
|---|---|---|---|
| 2020 | $17.50 | 5.94% | Strong cumulative growth |
| 2021 | $25.07 | 4.15% | Moderate growth from entry |
| 2022 | $22.80 | 4.56% | Solid appreciation |
| 2023 | $23.93 | 4.35% | Consistent performance |
| 2024 (Pre-Split) | $26.30 | 3.95% | Current market yield |
SCHD Yield on Cost Over Time
Note: All historical prices adjusted for 3-for-1 split for accurate comparison
The fund pays quarterly dividend returns to you, providing you with a stable income while monitoring growth. The ex-dividend dates are usually in March, June, September, and December to enable stable income investment and cash flow planning.
How SCHD Yield Calculations Work (Post-Split)?
Calculate your potential SCHD income using this simple methodology:
Annual Income Formula:
- Number of shares × Current annual dividend per share = Annual income
- Example: 1,000 shares × $1.04 = $1,040 annual income
Yield on Cost Formula:
- (Current annual dividend ÷ Your purchase price) × 100 = Yield on cost
- Example: ($1.04 ÷ $25.07) × 100 = 4.15% yield on cost
Market Positioning and Competitive Analysis
SCHD’s yield is comfortably settled against its historic range, offering a sweet spot to those investors who are income-minded. The SCHD yield over S&P 500 exhibits a good premium, which reflects the fund’s dividend orientation compared to the entire market’s growth lean.
Historical patterns of SCHD yield consistent with resilience in every interest rate environment. Throughout the 2022-2023 Federal Reserve rate hike period, SCHD remained attractive compared to Treasury counterparts while offering growth opportunities missing from fixed income.
SCHD Dividend Yield History
The returns of SCHD have shown consistency throughout different market cycles, making strategic points of entry during market distress. Defensive asset allocation in the fund has allowed ongoing generation of income.
Recent Dividend Payment History (Post-Split Adjusted)
SCHD Dividend Calendar
| Ex-Dividend Date | Record Date | Payment Date | Amount |
|---|---|---|---|
| 2025-09-24 | 2025-09-24 | 2025-09-30 | $NA |
| 2025-06-25 | 2025-06-25 | 2025-06-30 | $0.2602 |
| 2025-03-26 | 2025-03-26 | 2025-03-31 | $0.249 |
| 2024-12-11 | 2024-12-11 | 2024-12-16 | $0.2645 |
| 2024-09-25 | 2025-09-25 | 2024-09-30 | $0.7545 |
Note: Pre-October 2024 dividends shown in split-adjusted amounts
Share Split Benefits for Investors
The October 2024 3-for-1 split lowered the share price, making SCHD more accessible without changing its solid fundamentals:
- Increased Accessibility: Lower $28.34 post-split price makes SCHD more accessible to smaller investors
- Enhanced Liquidity: Potentially improved trading liquidity with more shares outstanding
- Options Activity: May increase options trading activity due to standard 100-share contracts
- Psychological Appeal: Lower nominal share price may attract cost-conscious investors
Factors Driving Yield Changes
Interest rate effect on SCHD yield is a negative correlation to Treasury yields. Federal policy is behind large movements, with rate declines contributing to SCHD’s Treasury premium and favoring dividend-paying equities over fixed-income substitutes.
SCHD’s allocation in energy (21.08%), consumer staples (19.06%), and healthcare (15.68%) ensures defensive characteristics in downturns with persistent growth prospects in bull markets. The filter criteria of the fund for dividend quality ensures consistency even when individual stocks are struggling.
SCHD Dividend Growth: Consistency and Sustainability Analysis
Okay, so let’s analyze why SCHD’s dividend growth is making waves. The dividend growth of the fund is very strong with recent 1-year growth of 3.92% (on going), which reflects growing momentum. The direction is towards better fundamentals and not unsustainable distribution policies.
Growth Rate Performance Across Timeframes
| Time Period | Growth Rate | Performance Characteristics |
|---|---|---|
| 1-Year | 3.92% * | In the right path |
| 3-Year | 3.77% | Solid real growth despite volatility |
| 5-Year | 12.23% | Outstanding long-term wealth building |
| 10-Year | 10.58% | Consistent inflation outpacing |
SCHD Dividend Growth Rates
Sustainability Factors and Future Projections
The existing payout ratio of 62.08% offers very strong coverage for long-term expansion but is very defensive on payout policies. The largest positions of SCHD have strong fundamentals that enable dividend expansion to continue.
SCHD Top 10 Holdings Breakdown
| Company | Symbol | Allocation | Sector |
|---|---|---|---|
| TEXAS INSTRUMENT INC | TXN | 4.32% | Technology |
| CISCO SYSTEMS INC | CSCO | 4.24% | Technology |
| CHEVRON CORP | CVX | 4.18% | Energy |
| CONOCOPHILLIPS | COP | 4.15% | Energy |
| MERCK & CO INC | MRK | 4.08% | Healthcare |
| ALTRIA GROUP INC | MO | 3.98% | Consumer Defensive |
| ABBVIE INC | ABBV | 3.97% | Healthcare |
| AMGEN INC | AMGN | 3.91% | Healthcare |
| COCA-COLA | KO | 3.91% | Consumer Defensive |
| VERIZON COMMUNICATIONS INC | VZ | 3.90% | Communication Services |
SCHD Top Holdings
Source: Schwab Asset Management, June 26, 2025
These top 10 holdings represent approximately 42.36% of the fund’s total assets, showing balanced diversification across sectors while maintaining focus on quality dividend-paying companies.
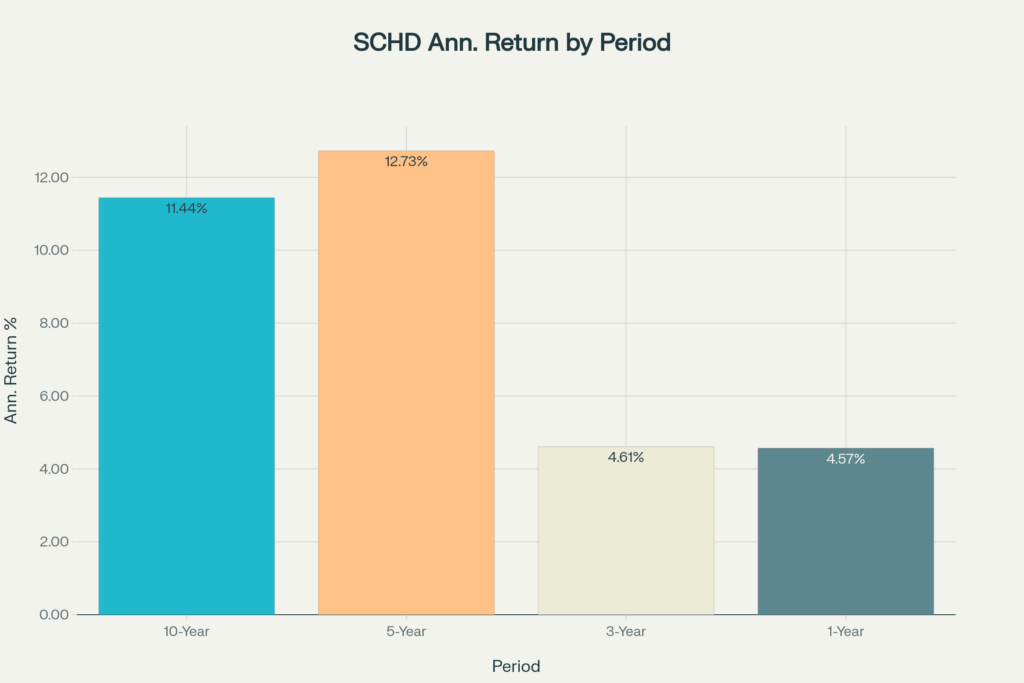
SCHD Growth Performance: Capital Appreciation and Total Returns
SCHD created excellent long-term performance with a 10-year average annual return of 10.58%, showing that growth dividend stocks provide both capital appreciation and income. The fund’s defensive stance has enabled it during market downturns.
Capital Growth Analysis
SCHD’s bear market performance is extremely strong. The focus on quality dividend stocks with solid balance sheets of the fund has historically been a better downstopper than that of broader market indexes.
Valuation and Growth Prospects
SCHD’s weighted average P/E ratio of 15.94 suggests reasonable valuations for growth prospects. The fund’s dividend screening creates a natural value tilt while capturing established companies with proven business models.
The expense ratio of 0.06% creates minimal drag compared to actively managed alternatives, allowing more underlying growth to flow through to investors.
SCHD Strategic Implementation: Balancing Yield and Growth
The relationship between SCHD yield and capital appreciation shows complementary dynamics that enhance total returns. The fund’s quarterly distribution schedule provides predictable income while maintaining growth potential.
Investment Strategy Scenarios (Post-Split Considerations)
| Strategy Approach | Benefits | Considerations |
|---|---|---|
| Buy & Hold (Cash Dividends) | Immediate income stream | Limited compound growth |
| Dividend Reinvestment | Maximum compound growth | Deferred income access |
| Dollar Cost Averaging | Reduced timing risk, easier with lower share price | Moderate growth potential |
| Market Timing | Potential for enhanced returns | Requires market timing skill |
Reinvesting those dividends?
That’s where the magic begins – earning compound interest with zero effort. The most opportune time to invest in SCHD for yield is during periods of market stress when valuations are most favorable. The lower post-split stock price of ~$28.34 provides dollar-cost averaging as an option for the smaller investor.
Optimal Allocation Strategies
| Investor Profile | Recommended Strategy | SCHD Allocation | Expected Outcome |
|---|---|---|---|
| Young Accumulator | Full dividend reinvestment | 30-50% of portfolio | Maximum long-term wealth |
| Pre-Retiree | Partial reinvestment | 40-60% of portfolio | Balanced growth and income |
| Current Retiree | Cash dividends | 20-40% of portfolio | Stable income stream |
| Conservative Income | DRIP with bond ladder | 25-35% of portfolio | Diversified income sources |
SCHD Investment Checklist
Before investing in SCHD, verify:
- ✓ Your investment timeline exceeds 5 years
- ✓ You understand dividend taxation in your situation
- ✓ You’re comfortable with moderate volatility
- ✓ You want both income and growth potential
- ✓ You prefer diversified exposure over individual stocks
- ✓ You understand the impact of the October 2024 3-for-1 split on historical comparisons
SCHD works best for investors who:
- Prioritize consistent income growth over maximum current yield
- Want professional management of dividend stock selection
- Seek tax-efficient income through qualified dividends
- Value low costs (0.06% expense ratio)
- Appreciate the accessibility of the post-split lower share price
SCHD Sustainability: Risk Assessment and Future Outlook
Long-term sustainability analysis indicates favorable defenses as well as areas of potential difficulty. SCHD’s concentration in established dividend-paying stocks offers stability but subjects risk to established companies potentially vulnerable to disruption.
Risk Factors and Mitigation
| Risk Category | Impact Level | Mitigation Factors | Monitoring Indicators |
|---|---|---|---|
| Interest Rate Sensitivity | Moderate | Dividend growth offsets rate impact | Fed policy, yield curve |
| Sector Concentration | Low | Diversified across multiple sectors | Sector rotation patterns |
| Dividend Cut Risk | Low | Quality screening methodology | Payout ratios, earnings coverage |
| Economic Recession | Moderate | Defensive sector allocation | GDP growth, employment |
| Inflation Pressure | Low | Real dividend growth history | CPI trends, wage inflation |
The emphasis of the fund on high-quality dividend stocks with sound fundamentals allows long-term results under different economic conditions. SCHD’s screening can ascertain companies with healthy competitive advantages and conservative payout policies.
Monitoring Framework and Implementation
Now we need to track SCHD’s dividend growth quarterly to identify trajectory changes. Monitor the fund’s sector allocation and top holdings for any significant shifts that might impact performance characteristics.
Key Performance Indicators
| Frequency | Metrics to Track | Purpose |
|---|---|---|
| Quarterly | Current yield, dividend per share growth, distribution dates | Track immediate performance |
| Annual | Total return breakdown, sector allocation changes, expense comparisons | Assess long-term trends |
| Market Context | Interest rate impact, relative yield premium analysis | Understand positioning |
| Sustainability | Payout ratios, earnings growth, dividend quality metrics | Evaluate future viability |
SCHD dividend reinvestment plans provide better long-term wealth-building methods for investors with long-term perspectives. The fund’s better dividend growth qualities benefit long-term wealth-building methods.
Alright, SCHD’s 3.86% SEC SCHD yield and dividend growth support a very attractive package that will attract those who want income as well as wealth creation. The 3-for-1 split in October 2024 has made the shares less expensive without decreasing the value of the underlying investment. From here, your success will be a function of smart strategies in terms of your goals, with a sharp focus on key performance measures.